
august 07, 2026
Metadata as the foundation of enterprise analytics
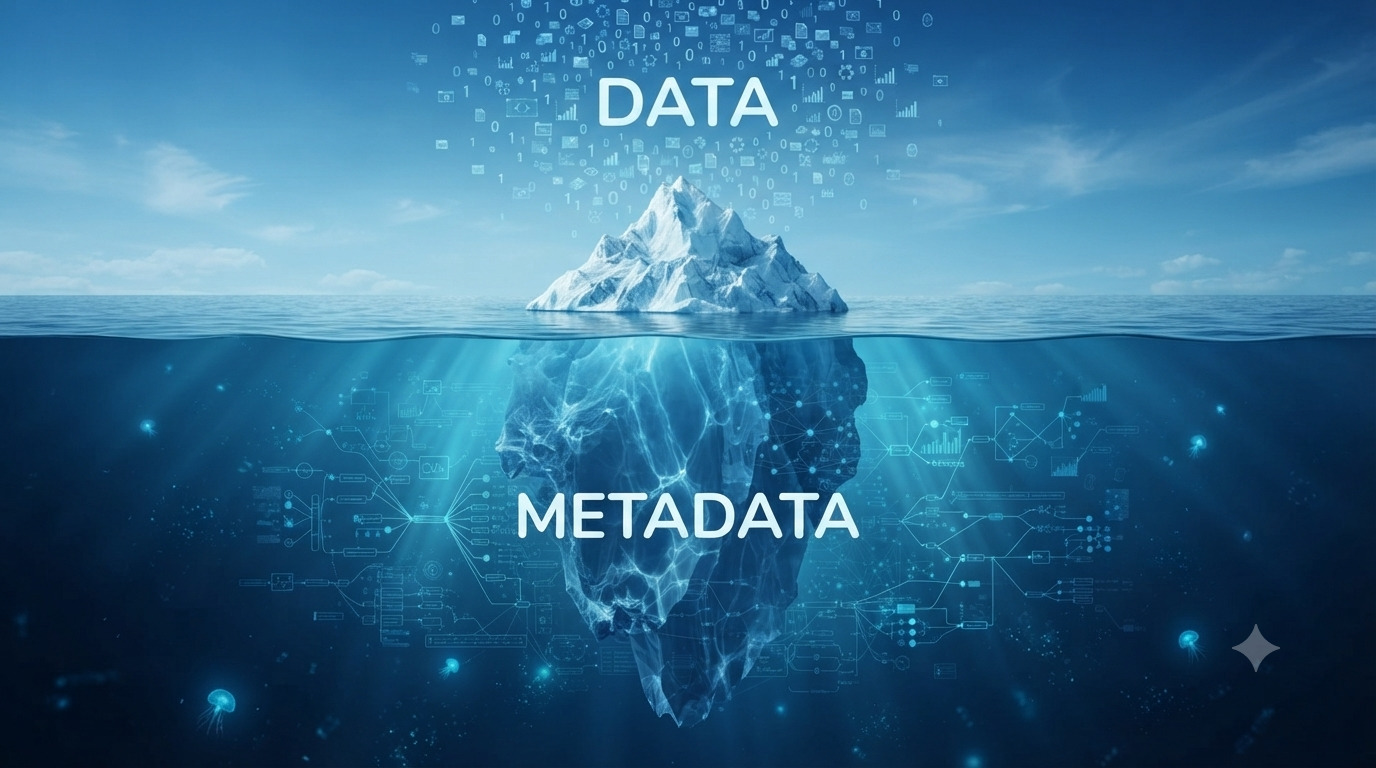
Modern enterprise analytics is evolving rapidly. On the one hand, companies deploy BI systems, build reporting frameworks, and work with large volumes of data to support fact-based management decisions. On the other hand, despite technological advancements, trust in data within organisations does not always remain high.
Quite often, the exact same indicator can differ across various reports, even when visually referring to the same business result. An attempt to determine the causes of such discrepancies frequently turns into a separate task requiring alignment between analysts, developers, and business users.
The reason most often lies neither in the visualisation tools nor in the quality of the data itself. The primary challenge relates to the lack of a unified understanding of what indicators actually mean, how they are calculated, and who is responsible for their correctness.
This is precisely why BI projects are paying increasing attention to metadata — information that describes data and helps interpret it consistently across the entire company.
In this article, we will examine the role metadata plays in enterprise analytics, how a data dictionary differs from a metric registry, and why they become the foundation for building a unified analytical environment.

What is metadata
Metadata is generally understood as data about data. For example, if a report uses the indicator «Sales», metadata helps clarify which source it is obtained from, how it is calculated, and who is responsible for its correctness.
However, in analytics, metadata describes more than just individual fields and tables. It makes it possible to formalise metric definitions, calculation rules, data sources, and responsible personnel. It is precisely because of this that the business, analysts, and developers can understand and use data in the exact same way.
In effect, metadata becomes the linking element between technical implementation and the business context of information.
Data dictionary and metric registry: why it is important to use them together
One of the most common metadata management tools is the Data Dictionary. Its main task is to describe the technical structure of data. The dictionary formalises tables, fields, data types, relationships between objects, and the rules for their usage. Such a tool is useful for developers, data engineers, and system administrators, as it helps them understand how data is structured within the system.
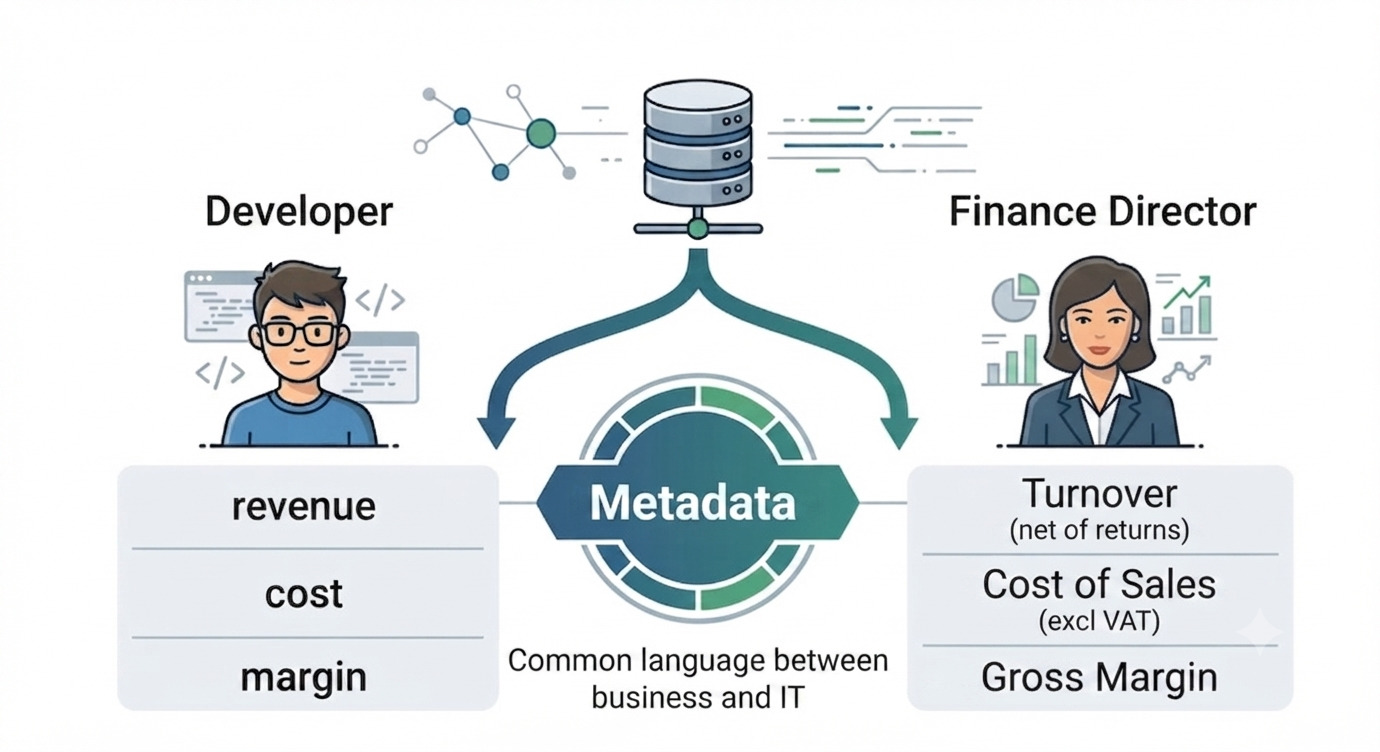
However, for the business, this level of description is usually insufficient. Executives and analysts are interested not in field names in a database, but in the indicators they see in reporting: sales, margin, revenue, profit margin, supplier efficiency, and other metrics.
Therefore, in enterprise analytics, a data dictionary is often supplemented by a metric registry. While a data dictionary describes what is stored in the system, a metric registry explains what a business metric means and how it should be interpreted.
The difference between these tools can be illustrated as follows:
| Data Dictionary | Metric registry |
|---|---|
|
Describes data |
Describes business metrics |
|
Target audience: technical specialists |
Target audience: business users and analysts |
|
Contains tables and fields |
Contains metrics and KPIs |
|
Answers the question «What is stored in the system?» |
Answers the question «What does the metric mean?» |
It is important to understand that these tools do not compete with each other. On the contrary, they address different tasks and together form an integrated metadata management system.
Using these tools in combination makes it possible to establish a unified understanding of data across the entire company. The technical team understands the data structure, while the business and analysts understand the meaning of metrics and the rules for their interpretation.
What happens when there is no metric registry
In many companies, metrics begin to take on a life of their own.
For example, in one report, the «Sales» metric is calculated based on the order date, in another — by the dispatch date, and in a third — only taking confirmed transactions into account. Formally, the name of the metric remains identical, but in practice, these are completely different indicators.
As a result, typical problems arise:
- Business users receive different values for the exact same metric across different reports.
- Analysts regularly spend time answering queries regarding the origin of figures instead of developing reporting.
- New employees spend weeks trying to understand existing metrics.
- When business logic changes, it becomes difficult to determine which reports need to be updated.
- Executives lose trust in analytics and start resorting to their own files and calculations.
Over time, the cost of such discrepancies becomes significantly higher than the expense of maintaining a unified metric registry.
A registry helps prevent such situations by serving as a single source of truth for metrics. Any employee can quickly understand what a metric means, how it is calculated, and where it is used.
How a metric registry looks in practice
Despite its rather complex name, in most companies, a metric registry begins as a standard spreadsheet. Each entry in the registry describes an individual metric and contains the information required by both business users and analysts.
For example, for the «Profit margin» metric, the registry may specify its business description, calculation formula, data source, owning department, used reports, and the date of the last update.
A simplified example might look as follows:
| Metric | Description | Formula | Data source | Owner |
|---|---|---|---|---|
|
Sales |
Total sales for the period |
Sum of sales |
dbo.fact_Sales |
Commercial Department |
|
Margin |
Difference between sales and cost of goods sold |
Sales − Cost of goods sold |
dbo.fact_Finance |
Finance Department |
|
Profit margin, % |
Share of margin in sales |
Margin / Sales × 100% |
dbo.fact_Finance |
Finance Department |
In practice, a registry usually contains significantly more information. Beyond the basic description, companies frequently add metric categories, update frequencies, linked reports, associated data marts, links to SQL implementations or BI models, metric statuses, and change histories.
As the analytical environment matures, such a registry gradually transforms from a simple spreadsheet into a fully fledged catalogue of business metrics, becoming one of the core components of the metadata management system.
Why this topic is becoming particularly relevant today
Just a few years ago, a metric registry was viewed primarily as a documentation and knowledge management tool. Today, its importance has grown significantly.
The reason for this is the rapid rise in interest surrounding artificial intelligence and AI analytics assistants.
For a human, a brief description of a metric is often enough to grasp its meaning. Artificial intelligence operates differently. To answer user queries correctly, it must understand not only the structure of the data, but also the business context: what the metric means, how it is calculated, and which rules are applied within the company.
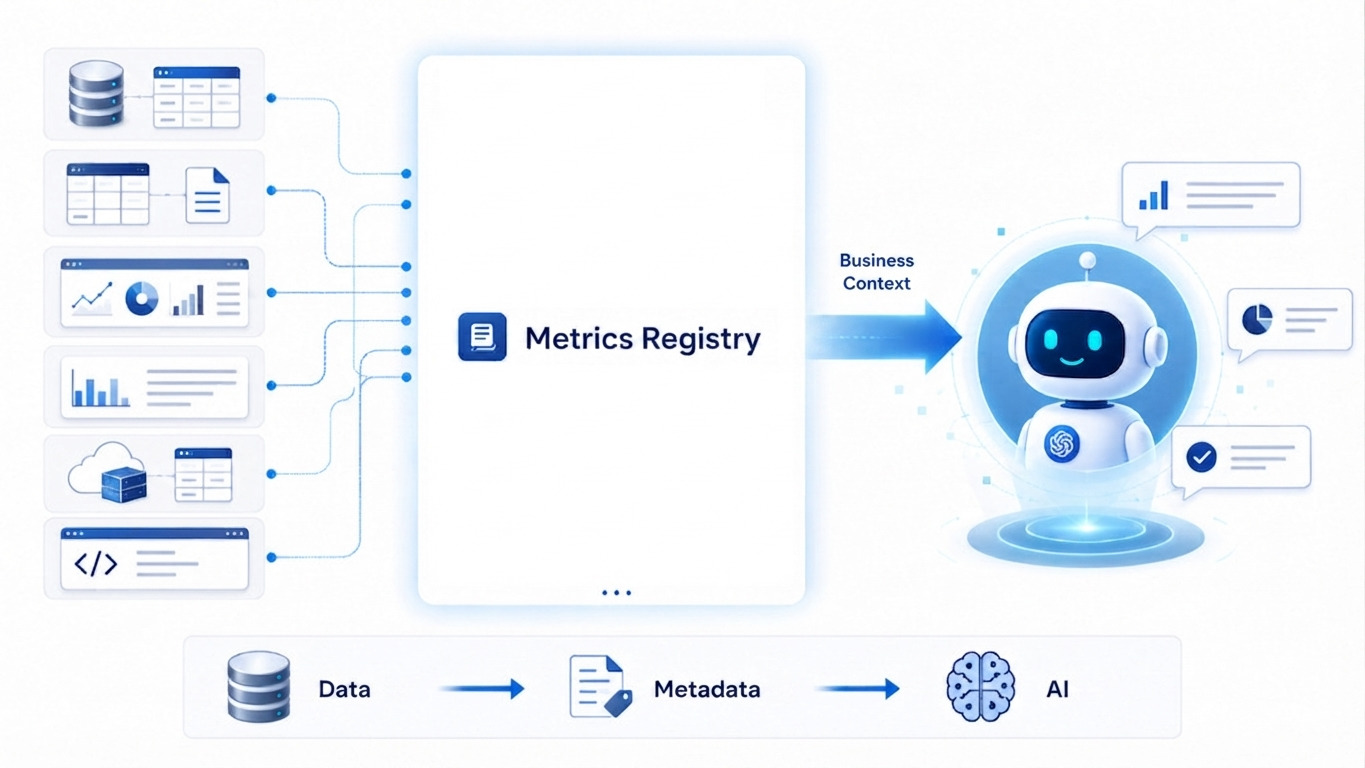
In essence, a high-quality metric registry becomes one of the primary knowledge sources for AI systems. The better metrics and their relationships are documented, the higher the likelihood of obtaining an accurate analytical response.
Consequently, many organisations today view metadata management not merely as a task for BI teams, but as an essential step towards leveraging artificial intelligence in enterprise analytics.
Conclusion
As data volumes and analytical solutions expand, the primary challenge is no longer the collection of information, but ensuring a unified understanding of that information across the company.
A metric registry helps formalise the business meaning of metrics, reduce reporting discrepancies, and establish a single source of truth for all indicators. It serves as the foundation for building a semantic layer, which ensures consistent metric usage throughout the entire analytical environment.
As a result, the company gains not just a set of reports, but an integrated data management ecosystem where the business, analysts, and developers rely on unified definitions and share the exact same understanding of key performance metrics.
